This procedure has saved me more than once, so I need to document it throughly for everyone! There are cases where I see messages (in the debugger console) that are like this;
[sourcecode language=’c’] >-[NSFetchedResultsController class]: message sent to deallocated instance 0x11957d0[/sourcecode]
Sometimes, it will talk about “freed” instead of deallocated. That address at the end is important. To track down the line of code where the object was allocated, you’ll need to set a couple environment settings. To do this, right click on the executable you’re trying to debug and select “get info”. Select the “arguments” tag and set the values shown below;
[sourcecode language=’c’]MallocStackLoggingNoCompact 1[/sourcecode]
NSZombieEnabled YES
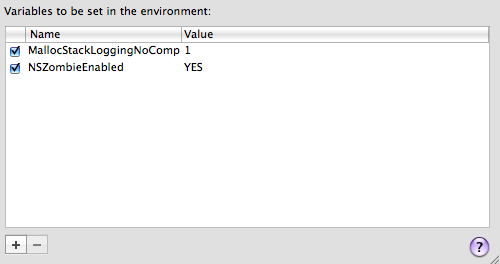
(be sure to disable these when you’re done. They should not be enabled for a production build!)
Next, run your program and test enough to generate the error. In the Debugger Console, copy that hex address value, then type the command;
(gdb) info malloc-history <paste-address-here>
You should see something like this;
Stack – pthread: 0xa0416720 number of frames: 28
0: 0x9264382d in malloc_zone_calloc
1: 0×92643782 in calloc
2: 0×93611618 in _internal_class_createInstanceFromZone
3: 0x9361ab08 in _internal_class_createInstance
4: 0x3020275c in +[NSObject allocWithZone:]
5: 0x3020264a in +[NSObject alloc]
6: 0x3d92 in -[AMRAPViewController fetchedResultsController] at /Users/dkavanagh/CrossFit Timer/Classes/AMRAPViewController.m:146
7: 0x3a18 in -[AMRAPViewController viewWillAppear:] at /Users/dkavanagh/CrossFit Timer/Classes/AMRAPViewController.m:96
8: 0x3097c945 in -[UINavigationController _startTransition:fromViewController:toViewController:]
9: 0x30977c33 in -[UINavigationController _startDeferredTransitionIfNeeded]
10: 0x3097d01e in -[UINavigationController pushViewController:transition:forceImmediate:]
The first line below the object alloc (in my case, line 6) will show where the offending object was allocated and should really help in tracking down the free/dealloc problem.